
Most brands' Klaviyo flows look fine from the outside. They're live. They send. Open rates are passable. But when we get inside the account, the revenue picture tells a different story.
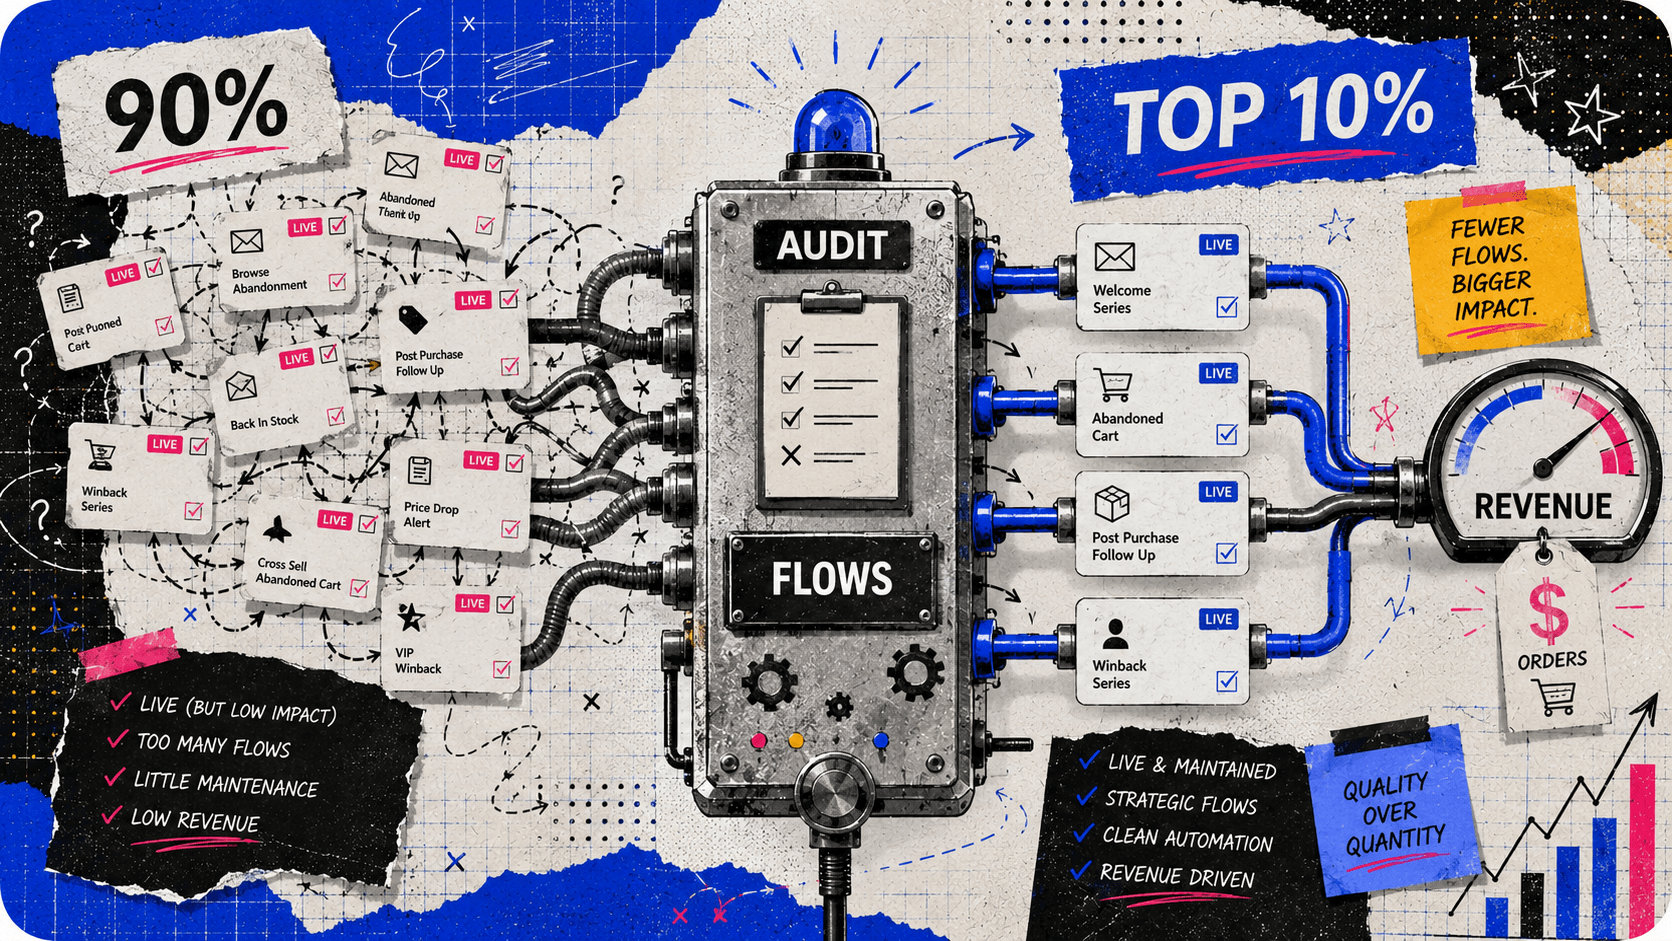
Across 50+ Klaviyo audits, the accounts generating the strongest email revenue aren't the ones with the most flows. They're the ones where a small number of flows are built correctly and maintained. The bottom 90% aren't failing because they ignored Klaviyo flows — most tried. The problem is that the flows were built to check a box, not to move revenue.
This post breaks down exactly what separates the top 10% of Klaviyo flows we audit — and the specific patterns the rest almost always share.
TL;DR
- Top 10% accounts generate 30–40% of total Klaviyo revenue from flows. Below 20% is a structural problem, not a campaigns problem.
- Cart abandonment, not welcome, is the highest revenue-per-send flow in our portfolio data — win-back and post-purchase are reliably the weakest.
- The most common audit finding isn't missing flows — it's Klaviyo flows that exist but haven't been reviewed since setup.
- Campaigns and flows running against each other during promotional periods is the most expensive and least visible mistake we find.
- List health degrades silently, but our data shows a specific unsubscribe range that actually correlates with the strongest revenue — not just “lower is better.”
What Do Healthy Klaviyo Flows Actually Look Like?
Healthy Klaviyo flows are the gap between what an account appears to be doing and what it's actually producing. Flows that exist but haven't been reviewed since setup. Segments built on the wrong criteria. Campaigns and flows sending conflicting messages to the same subscriber at the same time. List health problems that have been accumulating for months.
A Klaviyo audit isn't a checklist of whether flows exist. Any account can have flows. The question is whether they're working — and working in the right direction.
Five areas we examine in every Klaviyo flows audit:
- Flow architecture and trigger logic. Are the five core flows live, correctly triggered, and suppressing properly? Are purchasers exiting welcome flows on conversion? Are flows coordinated with campaigns or competing against them?
- Segmentation quality. Are segments built on purchase behavior, engagement recency, and category affinity — or on time windows that don't reflect actual customer status? A segment called “engaged subscribers” that pulls everyone who opened one email in the last 365 days is not a useful segment.
- List health. What percentage of the list is genuinely engaged? Cold contacts accumulate without suppression, pull down aggregate engagement metrics, and degrade deliverability over time. By the time open rates drop visibly, the damage has been building for six to twelve months.
- Campaign and flow coordination. During promotional periods, do flows update to reflect the current offer? Or do welcome series and abandonment flows send evergreen messaging while campaigns push a sale — creating a disjointed experience where three touchpoints send three different messages to the same subscriber?
- Attribution and measurement. Is the account measuring what matters? Revenue per recipient, flow conversion rate by sequence step, and repeat purchase rate attributed to lifecycle flows tell you more than open rate and click rate alone.
Sound familiar? If no one has reviewed your Klaviyo flows since they were built, at least two of these five areas have almost certainly drifted.
How Do I Know if My Klaviyo Flows Are Set Up Correctly?
The fastest diagnostic is flow revenue as a percentage of total Klaviyo attributed revenue. In a healthy account, flows generate 30–40% of that total. Below 20% means the account is campaign-dependent — revenue drops when campaigns stop, and the lifecycle infrastructure isn't doing its job.
Three additional signals that point to structural problems in your Klaviyo flows:
- Welcome flow conversion rate below 5%. A healthy sequence converts 8–12% of new subscribers to first-time buyers across the full series. Below 5% usually means the flow ends too early or sends identical content regardless of how the subscriber joined.
- Abandoned cart recovery rate below 8%. A three-email sequence should recover 10–15% of abandoned carts. Below 8% almost always means the flow ends after one email.
- Open rates declining quarter over quarter without a list growth explanation. Declining open rates in a stable or growing list point to list health degradation — cold contacts accumulating without suppression and dragging down aggregate engagement.
“Most brands still miss the fact that email marketing is about lifecycle timing, not just blast frequency.”
What Do Klaviyo Flow Benchmarks Actually Show?
Every account we audit assumes welcome is the flagship flow. Our own portfolio data says otherwise.
Pulling flow-by-flow revenue-per-send (RPS) data from 14 accounts in our portfolio with clean flow taxonomy and attribution — part of a broader dataset spanning 4,000+ campaigns across 40+ accounts, normalized across Klaviyo, Postscript, and Attentive over a trailing 12 months:
| Flow Type | Revenue Per Send | Adoption Rate |
|---|---|---|
| Cart Abandonment | $1.50 | 100% |
| Welcome | $1.01 | 100% |
| Loyalty/Referral | $1.00 | 50% |
| Back in Stock | $0.84 | 29% |
| Browse Abandonment | $0.41 | — |
| Cross-Sell/Upsell | $0.35 | — |
| Winback | $0.32 | — |
| Replenishment | $0.28 | — |
| Subscription Ops | $0.21 | — |
| Post Purchase | $0.19 | — |
Cart abandonment outperforms welcome on a per-send basis — the highest-intent moment in the lifecycle is still the highest-intent moment, even after Klaviyo defaults have made welcome flows table stakes. Win-back and post-purchase sit at the bottom, which lines up with what we see structurally: these are usually the least-segmented, least-maintained flows in an account, not just the least novel ones. Read the full Email Flow Performance Report →
The Five Core Klaviyo Flows: Where the Revenue Actually Sits
Every account needs the same five flows working — we've covered how to structure each one elsewhere. What this audit adds is what each flow is actually worth once it's live, and the specific way each one tends to underperform even when it looks complete on paper.
1. Welcome Flow
$1.01 revenue per send in the accounts we audit. The one thing that separates top performers: email #1 carries 60–90% of the flow's total revenue on its own, and the accounts leaving money on the table are almost always the ones that buried a weak offer past email #1 instead of leading with a strong one.
2. Cart Abandonment Flow
$1.50 revenue per send — the highest-earning flow in our benchmarks. The gap we find most often: over 60% of the accounts we audit still run this as a single email, when Klaviyo's own guidance is that 2–3 abandoned cart messages perform best. Our abandoned cart email guide covers the full build.
3. Browse Abandonment Flow
$0.41 revenue per send. The most common audit finding: content that never references the specific product a visitor viewed, turning a warm signal into a forgettable email.
4. Post-Purchase Flow
$0.19 revenue per send — the lowest of the ten flow types we benchmark. Almost always because it's treated as purely transactional instead of a relationship-building touchpoint.
5. Win-Back Flow
$0.32 revenue per send, and almost always the highest-volume flow in the account. The fix we see move the number fastest: segmenting by lapse recency instead of sending one blanket sequence to everyone who's gone cold.
The Most Common Klaviyo Flow Mistakes
Across 50+ audits, five mistakes appear in the majority of underperforming Klaviyo flows. None of them require advanced Klaviyo knowledge to fix. All of them cost real revenue every day they run unchanged.
Flows and Campaigns Running Against Each Other
This is the most expensive and least visible problem we find. During a promotional period, a brand sends a 20% off campaign to the full list. Simultaneously, the welcome flow sends an evergreen brand story email with no mention of the offer. The abandoned cart flow sends a reminder at full price. Three touchpoints, three conflicting messages, one confused subscriber.
The fix is flow scheduling — updating evergreen flows to reflect the current promotional context during campaigns, then reverting automatically when the promotion ends. Klaviyo supports this natively. Most accounts don't use it.
When we rebuilt the full flow architecture for a rugged gear brand before BFCM — coordinating flows and campaigns so they reinforced each other rather than competed — BFCM revenue grew 679.9% year-over-year against a 100% target. Orders went from 3,106 to 13,996. The root cause wasn't the offer or the list size. It was structural misalignment between flows and campaigns.
Weak Offers, or No Story Around the Offer That Is There
Our Welcome Series Anatomy Report — an analysis of the top 5 welcome flows across 5 brands — found that email #1, the one carrying the offer, generates 60–90% of total welcome series revenue on its own. Trying to withhold or bury the offer past email #1 usually just costs revenue: the same analysis found a $25 discount outperformed an otherwise identical $10 discount by +22% revenue per recipient.
The real mistake isn't leading with an offer — it's leading with a weak one, or repeating the same generic pitch in emails #2–#4 instead of using them for founder voice and proof. In the flows we studied, only 23% of winning follow-up emails used founder voice at all, while email #1 almost never did — because email #1's job is the offer, and the story belongs after it. Read the full Welcome Series Anatomy Report →
Segments Built on Time Windows, Not Behavior
“Engaged in the last 90 days” includes a contact who opened one email 89 days ago and never engaged again. Behavioral segmentation — built on purchase frequency, category affinity, browse behavior, and combined engagement signals — consistently outperforms time-window segments in both deliverability and downstream conversion.
No Suppression Logic in Core Flows
Purchasers who convert during the welcome flow should exit it immediately and enter post-purchase. Contacts who haven't opened after email three of a win-back sequence should exit and enter list hygiene. Flows without suppression logic send the same sequence to everyone regardless of what happened during it — inflating send volume, degrading deliverability, and making performance data impossible to read accurately.
Measuring Success by Open Rate
Open rate is an attention metric. It tells you whether the subject line worked. It says nothing about whether the flow moved revenue. Accounts that optimize for open rate without tracking revenue per recipient, flow conversion rate, and repeat purchase rate are optimizing for visibility, not results.
What Separates the Top 10% of Klaviyo Flows
After 50+ audits across DTC brands at $1M to $20M in annual revenue, the top 10% share five characteristics the bottom 90% almost never have simultaneously.
| Characteristic | Top 10% | Bottom 90% |
|---|---|---|
| Flow revenue share | 30–40% of total Klaviyo revenue | Below 20% — campaign dependent |
| Campaign and flow coordination | Flows update during promotional periods | Evergreen flows run unchanged during sales |
| Segmentation basis | Purchase behavior, engagement recency, category affinity | Time windows and broad engagement flags |
| List health management | Regular suppression, active hygiene flows | Cold contacts accumulate without suppression |
| Primary success metric | Revenue per recipient, repeat purchase rate | Open rate and click rate |
The top 10% aren't running more flows. They're running fewer flows properly and reviewing them on a regular cadence. The accounts generating the strongest email revenue in our portfolio are the ones where someone made a decision to stop adding complexity and start maintaining what exists.
That review-and-maintain discipline is exactly how our team runs retention for the brands we work with. See how we handle Klaviyo flows day to day →
What We Find in Almost Every Klaviyo Flows Audit
Three findings that surprise almost every brand:
Their highest-volume flow is also their lowest-performing one. Win-back flows almost always have the largest send volume in an account — because they target everyone who hasn't purchased in 60–90 days, which compounds into a large segment over time. They also sit near the bottom of our revenue-per-send benchmarks ($0.32, ahead of only replenishment, subscription ops, and post-purchase). Segmenting win-back by lapse recency consistently improves performance without changing the creative.
Their abandoned cart flow ends after one email. Over 60% of the accounts we audit have a single-email abandoned cart sequence. The recovery rate on one email is a fraction of what a three-email sequence produces — not because of creative quality, but because one touchpoint isn't enough to recover someone who left for different reasons at different times.
Their unsubscribe rate is either too low or too high, and both are a problem. Our Unsubscribe Calibration Report — 126 broadcast campaigns across 31 active senders — found that campaigns landing in the 0.4–0.7% unsubscribe range actually correlate with the highest revenue per recipient, 5.2x higher than low-unsub campaigns.
Below 0.1%, the account is under-pushing and leaving revenue on the table. Above 1%, it's a genuine list-health red flag. Most accounts we audit are chasing “as low as possible” instead of finding that calibrated middle. Read the full Unsubscribe Calibration Report →
Frequently Asked Questions
1. What Separates Good Klaviyo Flows From Bad Ones?
Good Klaviyo flows are coordinated with campaigns, segmented on behavior rather than time windows, and generate 30–40% of total Klaviyo attributed revenue. Bad ones exist but haven't been reviewed since setup, run evergreen messaging during active promotions, and generate activity without generating revenue. Flow revenue percentage, welcome flow conversion rate, and abandoned cart recovery rate are the three fastest diagnostic signals.
2. How Many Klaviyo Flows Do I Need?
Five core flows cover most of the revenue opportunity: welcome, cart abandonment, browse abandonment, post-purchase, and win-back. Adoption data from our portfolio shows welcome and cart abandonment running in nearly 100% of accounts, while higher-value flows like back-in-stock (29% adoption) and loyalty/referral (50% adoption) are still underused relative to their revenue-per-send. Get the core five working properly before adding more.
3. Which Klaviyo Flow Generates the Most Revenue Per Send?
Cart abandonment, not welcome. Across 14 accounts in our portfolio, cart abandonment averaged $1.50 in revenue per send versus $1.01 for welcome — the highest-intent moment in the customer journey still outperforms the highest-adoption flow. Win-back, replenishment, subscription ops, and post-purchase consistently rank lowest.
4. How Do I Know if My Klaviyo Flows Are Set Up Correctly?
Check three numbers: flow revenue as a percentage of total Klaviyo attributed revenue (healthy is 30–40%), welcome flow conversion rate across the full sequence (healthy is 8–12%), and abandoned cart recovery rate (healthy is 10–15%). If any of these are significantly below benchmark, there's a structural problem that adding more flows or campaigns won't fix.
5. How Often Should I Audit My Klaviyo Flows?
At minimum twice a year — and always before a major promotional period like BFCM. Flows drift. Copy goes stale. Segments that were accurate six months ago pull the wrong contacts today. Accounts that review core flows quarterly and run a full audit before major promotional periods consistently outperform ones that build flows and leave them running without review.
6. What's the Fastest Way to Improve Klaviyo Flow Performance Without Rebuilding Everything?
Fix flow and campaign coordination first. Update evergreen flows to reflect the current promotional context during active campaigns, and revert automatically when promotions end. This single change removes the most expensive structural problem in most accounts — conflicting messages undermining conversion — without requiring a full rebuild of any individual flow.