
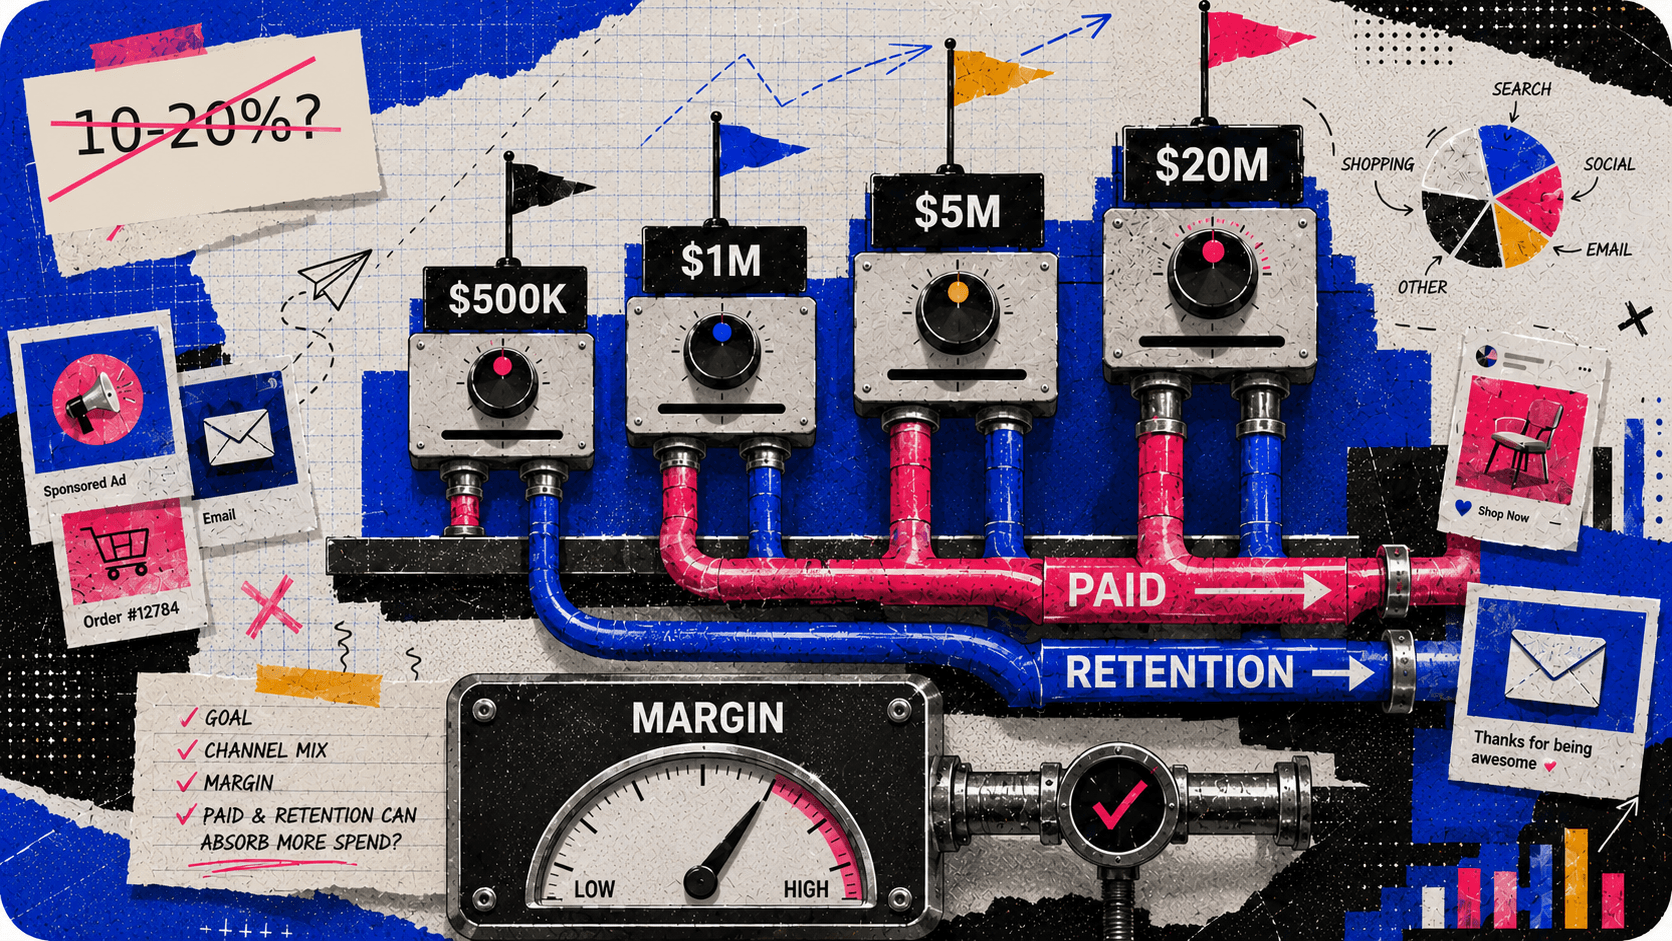
Every DTC founder eventually asks the same question: how much of an ecommerce marketing budget should we actually be running? The answer they usually get — “10–20% of revenue” — is borrowed from general marketing textbooks and applied to ecommerce brands without any adjustment for revenue stage, channel mix, or margin structure.
What we've seen with brands at revenue stages from $500K to $20M annually is that the right ecommerce marketing budget isn't a single percentage. It's a function of where you are, what you're trying to accomplish, and whether the channels you're spending on are ready to absorb more spend efficiently.
This post breaks down what an ecommerce marketing budget actually looks like at each revenue stage — in percentages and in dollars — why the split between paid and retention changes as brands grow, and what the benchmarks mean in practice.
TL;DR
- Marketing budget as a percentage of revenue is a useful starting point but a poor optimization target — contribution margin and MER are what actually tell you whether the allocation is working.
- At $1M revenue, most healthy DTC brands spend 15–25% of revenue on marketing, weighted heavily toward paid acquisition.
- At $5M+, the allocation shifts: paid spend stabilizes as a percentage, email and retention capture a larger share, and total marketing efficiency becomes the primary metric.
- Every budget increase carries a measurable efficiency cost regardless of size — a 5–6% CAC tax per jump — so how often you change budget matters more than how much you change it by.
- Brands that optimize for ROAS at the campaign level while ignoring blended MER consistently overspend on acquisition and underspend on retention.
What's a Realistic Ecommerce Marketing Budget by Revenue Stage?
The right ecommerce marketing budget depends on three variables: revenue stage, margin structure, and channel readiness. A $1M brand allocating 20% of revenue to paid media with no email foundation is in a different position than a $5M brand allocating 20% with a functioning lifecycle system underneath.
The benchmark most brands use — 10–20% of revenue — describes what healthy looks like in aggregate across all marketing spend. It doesn't describe what a healthy allocation looks like by channel, by stage, or by margin structure.
Applied without context, it leads brands to either underspend on acquisition during growth phases or overspend on channels that aren't ready to absorb more budget efficiently.
Percentage-of-Revenue vs. Objective-Based: Which Budgeting Method Should You Use?
Most ecommerce marketing budget guides recommend one of three methods:
- Percentage-of-revenue. Set spend as a fixed share of revenue — the approach behind every benchmark table in this post. Simple, but backward-looking: it budgets off what the business already made, not what a channel can efficiently absorb this month.
- Objective/task-based. Work backward from a specific outcome — “acquire 500 new customers this quarter” — and cost it out channel by channel. More precise, but it requires the CAC and channel-conversion data most brands under $3M don't have yet.
- Competitive parity. Match category spend levels. We don't recommend this one. It tells you nothing about your own margin structure or retention economics, and it's the fastest way to overspend on paid media because a competitor is.
In practice, the brands in our portfolio that scale most efficiently start with percentage-of-revenue as the baseline allocation and graduate to objective/task-based budgeting once MER visibility and new customer CAC data exist — usually somewhere between $1M and $3M in revenue.
Ecommerce Marketing Budget Benchmarks by Revenue Stage
These are directional ranges from our portfolio of over 50 DTC brands. Individual brand economics vary by category, AOV, and margin structure. Use these as a diagnostic for your own allocation, not a target.
| Revenue Stage | Total Budget (% of Rev.) | Paid Acquisition Share | Email/Retention Share | Notes |
|---|---|---|---|---|
| Under $1M | 20–35% | 70–80% of marketing budget | 10–15% | Heavy acquisition phase. Foundation building. |
| $1M–$3M | 15–25% | 60–70% | 15–20% | Paid scaling. Email foundation should be live. |
| $3M–$5M | 12–20% | 55–65% | 20–25% | Efficiency gains start compounding. |
| $5M–$10M | 10–18% | 50–60% | 25–30% | Retention spend materially affects LTV. |
| $10M+ | 8–15% | 45–55% | 25–35% | MER and contribution margin are primary metrics. |
Based on 52 DTC brands across fashion, CPG, supplements, home goods, and subscription categories. 2024–2025 data.
Two patterns hold consistently across these stages. First, total marketing budget as a percentage of revenue tends to compress as revenue grows — efficiency compounds when the allocation is built correctly from the start.
Second, the share of the budget going to retention increases as brands scale, because the LTV math becomes more favorable than the CAC math at higher spend levels.
What Does an Ecommerce Marketing Budget Look Like in Dollars?
Percentages are useful for planning, but most founders think in dollars. Here's what the benchmarks above translate to at a representative revenue point within each tier — calculated directly from the percentage ranges, not a separate data set. Recompute against your own revenue rather than treating these as fixed targets.
| Revenue Stage | Representative Revenue | Total Monthly | Paid (Monthly) | Email/Retention (Monthly) |
|---|---|---|---|---|
| Under $1M | $750K/yr | ~$17K | ~$12.9K | ~$2.1K |
| $1M–$3M | $2M/yr | ~$33K | ~$21.7K | ~$5.8K |
| $3M–$5M | $4M/yr | ~$53K | ~$32K | ~$12K |
| $5M–$10M | $7.5M/yr | ~$87.5K | ~$48K | ~$24K |
| $10M+ | $15M/yr | ~$144K | ~$72K | ~$43K |
Calculated using the midpoint of each percentage range above against a representative revenue point within the tier. Your actual budget should be calculated against your own revenue, not these illustrative figures.
What's the Right Marketing Budget at $1M Revenue?
At $1M in annual revenue, most brands in our portfolio spend between 15–25% of revenue on marketing, with the majority weighted toward paid acquisition. This is the growth phase — the brand is building an audience, testing what creative and offers work, and establishing the channels that will carry it to the next stage.
The common mistake at this stage is treating the paid budget as the entire ecommerce marketing budget. Email, content, and retention are often deprioritized because they feel less immediate than paid.
But a brand at $1M that isn't building email and retention infrastructure is spending its paid budget to acquire customers into a system that doesn't keep them — which means the CAC at $1M compounds into a churn problem at $3M, and retention quietly becomes the real constraint on how far paid spend can scale.
The brands in our portfolio that scaled past $1M most efficiently had two things in place before they significantly increased paid spend: a product page converting cold traffic above 1.5% and core email flows generating at least 20% of Klaviyo attributed revenue. Paid on top of that foundation scales. Paid without it plateaus. Sound familiar? If paid spend is increasing but profit isn't following, the retention foundation is almost always where the gap lives. See how our email and retention marketing services close that gap →
What Metrics Should Actually Drive Your Ecommerce Marketing Budget?
ROAS is the metric most DTC brands use to evaluate paid media performance. It's also the metric most likely to mislead budget decisions — what a strong ROAS shows often has more to do with post-click conversion rate and AOV than with the ad itself.
“Return on Ad Spend is becoming a vanity metric. Real success is measured by Marketing Efficiency Ratio and bottom-line contribution margin.”
ROAS measures revenue generated per dollar of ad spend inside a specific platform's attribution window. It doesn't account for organic revenue that would have happened anyway, blended CAC across all channels, or the contribution margin after product cost, fulfillment, and overhead.
The metrics that actually tell you whether your ecommerce marketing budget is working:
- Marketing Efficiency Ratio (MER): Total revenue divided by total marketing spend across all channels. This is the blended picture — what the entire marketing investment is producing, not what any individual channel claims.
- New Customer CAC: What it actually costs to acquire a customer who hasn't bought before. Blended CAC includes repeat purchasers who would have bought anyway. New customer CAC tells you the true cost of growing the customer base.
- Contribution margin per acquired customer: Revenue minus variable costs (COGS, fulfillment, returns, payment processing) for customers acquired through paid media specifically. If contribution margin per paid-acquired customer is lower than contribution margin per organically acquired customer, paid media is acquiring a lower-quality customer cohort.
- LTV:CAC ratio at 90 and 180 days: How much value a paid-acquired customer generates relative to what was paid to acquire them. Below 2:1 at 90 days is a warning sign that the acquisition is not economically sustainable at scale.
The Hidden Cost of Increasing Your Ecommerce Marketing Budget Too Fast
Most budget advice stops at “here's what to spend.” It doesn't account for what happens the moment you actually increase spend.
In our Meta Ads Benchmarks report — an analysis of 511 budget increases across 10 brands, drawn from a portfolio with close to $400M in tracked ad spend — every budget jump carried a measurable efficiency cost: a 5–6% CAC tax, regardless of whether the increase was large or small. The tax peaks around days 6 to 9 (roughly +6.5%) and recovers to within about 3% of baseline by days 10–14.
Since the tax is roughly fixed per jump, the number of separate increases matters more than their size. Meta's own Significant Edits and Learning Phase documentation confirms budget changes can reset an ad set's learning phase depending on the magnitude of the change — so several small, reactive increases over a quarter can rack up more cumulative CAC tax than a couple of large, planned ones.
That's why an ecommerce marketing budget should move in fewer, deliberate steps tied to a clear trigger — a new profitability threshold, a revenue-stage change — rather than frequent reactive nudges. It's also part of why roughly 28% of ad spend across our portfolio sits in active testing at any given time — testing budget absorbs volatility so the core prospecting budget doesn't have to eat the full CAC tax on every change. Read the full Meta Ads Benchmarks report →
How Ecommerce Marketing Budget Allocation Shifts as Brands Scale
The pattern we see consistently across our portfolio: brands under $3M in revenue are acquisition-heavy by necessity. They need customers. Paid media is the fastest way to get them. Email and retention are important but secondary in the allocation.
From $3M to $10M, the allocation starts shifting. Paid media spend continues growing in absolute terms but stabilizes or compresses as a percentage of revenue. Email and retention begin generating a meaningful share of total revenue — and because the CAC on those channels approaches zero, MER improves even as total marketing spend grows.
Above $10M, the brands with the healthiest economics are the ones where retention has compounded into a genuine asset within the allocation. Email generates 30–40% of total revenue. Repeat customers represent a significant percentage of monthly orders. The marginal cost of paid acquisition is evaluated against a much more complete picture of LTV because the retention data actually exists.
When we scaled paid spend 6.7x for a premium pet brand — from $114K to $563K in monthly net profit — the efficiency gains weren't from the paid media alone. They came from a budget allocation that built prospecting infrastructure on top of a retention system that made acquired customers worth significantly more than the CAC to get them. Read the full case study →
Where Most DTC Brands Get Their Ecommerce Marketing Budget Wrong
Three misallocations we find most consistently across new client accounts — the same patterns we see across the seven most expensive mistakes DTC brands make scaling from $500K to $5M:
- Overweighting paid, underweighting retention at $1M–$3M. The brands that hit a ceiling at $3M–$5M in revenue almost always have the same profile: high paid spend, thin email revenue, and a customer base that churns because there's no retention system keeping them. The fix isn't cutting paid — it's building the email foundation that makes each paid-acquired customer worth more over time.
- Optimizing channel budgets independently without a blended view. Paid media team optimizes toward ROAS. Email team optimizes toward open rate. Nobody is looking at MER or contribution margin across all channels simultaneously. Allocation decisions get made in silos that look good locally but produce suboptimal results for the overall business.
- Cutting retention spend when acquisition is working. When paid media is performing well, the instinct is to pour more into what's working. But the brands that scale most efficiently through $5M and beyond are the ones that increase retention spend in proportion to acquisition spend — because the LTV of retained customers is what makes higher acquisition CAC sustainable.
| Misallocation | What It Looks Like | What It Costs |
|---|---|---|
| All budget in paid, no retention | Email revenue below 15% of total | High churn, declining LTV, unsustainable CAC |
| Channel budgets siloed | ROAS looks good, MER is declining | Overspend on paid, underspend on retention |
| Cutting retention during paid success | Strong new customer numbers, flat repeat rate | LTV doesn't compound, CAC ceiling hits sooner |
| Spending before foundation is ready | Paid traffic to low-converting page | Budget buys data about a broken funnel |
The Ecommerce Marketing Budget Framework We Use With Clients
Before recommending how to allocate a marketing budget, we establish three baselines:
- What is the current MER, and what does it need to be for the business to be profitable at current margin structure?
- What percentage of monthly revenue comes from repeat customers versus new customers? If below 20%, retention is underfunded regardless of what the email budget looks like on paper.
- What is the new customer CAC across all acquisition channels — not platform ROAS, but actual cost per new customer including all fees, creative production, and agency costs?
Those three numbers define the constraint. The budget allocation follows from there — not from a percentage benchmark borrowed from an industry report that doesn't know the brand's margin structure.
Sound familiar? If budget decisions are being made without MER visibility and new customer CAC clarity, the allocation is almost certainly optimizing for the wrong thing. See how we approach growth strategy →
Frequently Asked Questions
1. What Percentage of Revenue Should an Ecommerce Business Spend on Marketing?
It depends heavily on revenue stage. Most healthy DTC brands spend 20–35% of revenue on marketing under $1M, compressing down to 8–15% above $10M as retention compounds and paid efficiency improves. There's no single correct percentage — the range that fits your brand depends on whether email and retention infrastructure exists underneath the paid spend.
2. What's the Right Marketing Budget at $1M Revenue?
15–25% of revenue is the range we see most commonly, with 70–80% of that going to paid acquisition. The more important question at $1M is whether email and retention infrastructure is being built alongside paid spend. Brands that skip the retention foundation at $1M almost always hit an efficiency ceiling at $3M–$5M that more paid spend doesn't break through.
3. How Much Should I Spend on Marketing Per Month?
It scales with revenue and stage — roughly $17K/month at $750K in annual revenue, up to $144K/month at $15M, based on the percentage benchmarks in this post. These are illustrative figures calculated from percentage ranges, not fixed targets; recompute against your own revenue and margin structure.
4. What Is Marketing Efficiency Ratio and Why Does It Matter for Budget Allocation?
MER is total revenue divided by total marketing spend across all channels. It gives a blended picture of what the entire marketing investment is producing — unlike ROAS, which only measures revenue claimed by a specific channel's attribution window. At scale, MER is more useful than ROAS for allocation decisions because it accounts for the interaction between paid acquisition and organic or email-driven revenue.
5. Should I Increase My Marketing Budget Gradually or All at Once?
In fewer, deliberate steps — not via frequent small adjustments. Our own analysis of 511 budget increases across 10 brands found a 5–6% CAC tax after every increase, regardless of size, peaking around days 6–9 before recovering by days 10–14. Since the tax is roughly fixed per jump, making many small reactive changes racks up more cumulative CAC tax than making fewer, larger increases tied to a clear trigger like a new profitability threshold or a revenue-stage change.
6. How Do I Know if My Marketing Budget Allocation Is Wrong?
Three signals: email revenue below 20% of total revenue despite running paid at scale (retention is underfunded), MER declining while individual channel ROAS looks stable (channels are competing rather than compounding), and new customer CAC increasing quarter over quarter without a corresponding increase in LTV (acquisition quality is degrading). Any one of these points to a misallocation.
7. Should Marketing Budget Allocation Shift as Revenue Grows?
In absolute terms, total spend should grow. As a percentage of revenue, the allocation shifts toward retention. Brands scaling efficiently see total marketing spend grow in absolute terms while compressing slightly as a percentage of revenue — because retention compounds and paid efficiency improves on top of a stronger foundation. Brands that don't build retention see marketing spend grow as a percentage because they're re-acquiring customers they should have kept.