
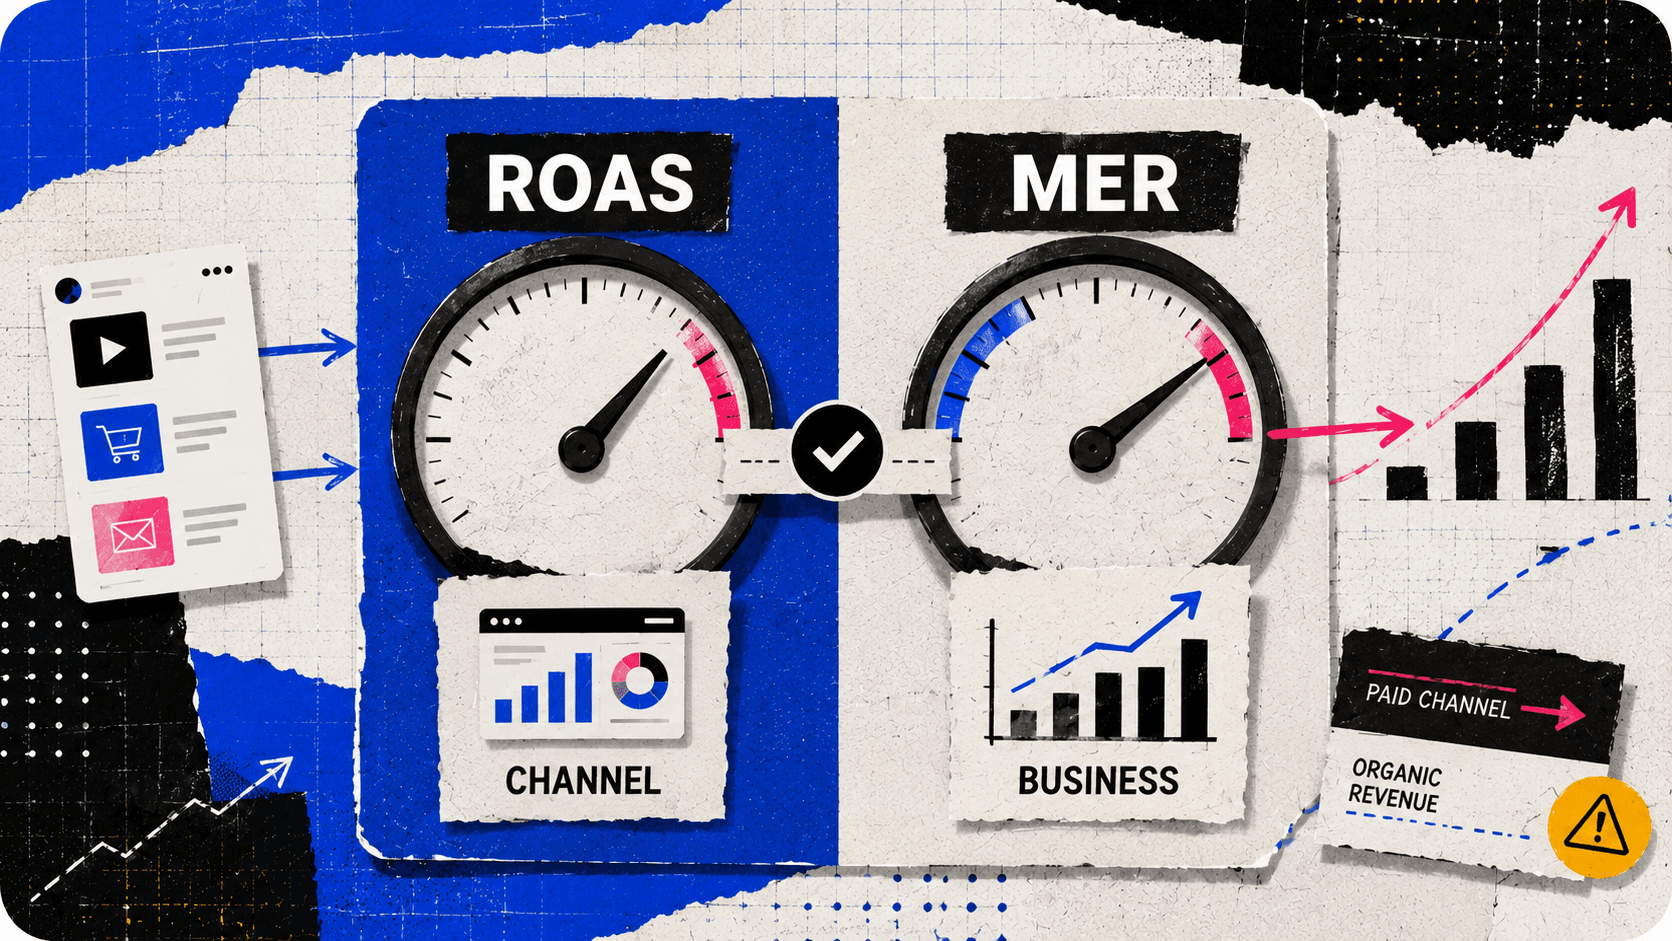
MER and ROAS answer two different questions, which is why the strongest DTC brands track both. ROAS tells you whether a channel looks efficient inside its own dashboard. MER tells you whether the entire marketing investment is actually growing the business.
Treat one as a substitute for the other and you will either scale a channel that is quietly cannibalizing organic revenue, or stall growth because you cannot see which lever to pull.
Across close to $400M in managed Meta spend, the pattern is consistent: platform ROAS is where optimization starts, and MER is where the truth lives. This post breaks down the difference, when to use each, and why you need both on the scorecard.
TL;DR
- MER (Marketing Efficiency Ratio) is total revenue divided by total marketing spend. It measures the whole business. ROAS measures one channel's self-attributed return.
- Neither is better. ROAS is a tactical, in-platform signal. MER is the strategic, business-level truth. You need both.
- Platform ROAS over-reports because every channel claims the same conversions. Blended ROAS removes the double-count, and MER goes further by counting all marketing spend.
- Optimizing to platform ROAS while MER declines is the most common and most expensive measurement mistake in DTC.
MER vs ROAS: What's the Difference?
MER, the Marketing Efficiency Ratio, is total revenue divided by total marketing spend across every channel. ROAS, return on ad spend, is the revenue a single platform attributes to itself divided by the spend on that platform. MER measures the whole business. ROAS measures one channel's self-reported slice of it.
The formulas make the gap clear. MER is total revenue divided by total marketing spend. ROAS is attributed revenue divided by ad spend, calculated separately inside each platform. One is blended and unattributed. The other is self-reported by the channel that benefits from looking good.
| MER (Marketing Efficiency Ratio) | ROAS (Return on Ad Spend) | |
|---|---|---|
| What it measures | Whole-business marketing efficiency | One channel's attributed return |
| Formula | Total revenue / total marketing spend | Attributed revenue / channel ad spend |
| Attribution | None, fully blended | Self-reported by the platform |
| Best for | Budget allocation, P&L, scaling decisions | Campaign, creative, and audience optimization |
| Blind spot | Cannot isolate which channel is working | Over-attributes, ignores cannibalization and margin |
| Who reads it | Founder and finance | Media buyer and channel team |
Which Metric Should DTC Brands Actually Use?
Both, for different decisions. Use ROAS inside a platform to judge campaigns, creative, and audiences, where fast channel-level signal is exactly what you need. Use MER at the business level to set budgets, decide whether scaling paid is actually growing revenue, and report to finance. ROAS answers “is this ad working.” MER answers “is the marketing working.”
The split maps to who is making the decision. A media buyer optimizing a Meta account needs ROAS and the metrics beneath it, which is where our data on what actually predicts Meta ROAS matters most. A founder deciding how much to put into paid versus retention needs MER, because that is the number that moves with budget allocation across the whole funnel.
MER also doubles as a planning tool: divide a revenue target by your target MER to back into the total marketing budget it implies. Run both and the tactical and strategic views finally agree on the same reality.
Blended ROAS vs Platform ROAS: Why the Gap Matters
Platform ROAS is what each platform claims for itself. Because Meta, Google, and every other channel take credit for the same conversions, those numbers add up to more revenue than the business actually made.
Blended ROAS fixes the double-count by dividing total revenue by total ad spend. MER goes one step further by counting all marketing spend, not just ad spend. (You will see the same idea under other names: some teams call it blended ROAS or eROAS. Amazon sellers track the mirror image, TACoS, which is ad spend as a percentage of total revenue.)
The gap is not academic. Since Apple's App Tracking Transparency changes reshaped attribution, platform-reported figures tend to overstate real return.
Our Meta ads benchmarks research found that the metrics teams optimize toward often do not predict profit at all: across 3,859 ads, hook rate, hold rate, and click-through rate each had essentially no relationship with CAC or ROAS. Scale a channel showing a 4x platform ROAS while your MER slips, and the channel is claiming revenue that organic and direct would have earned anyway.
“Return on Ad Spend is becoming a vanity metric. Real success is measured by Marketing Efficiency Ratio and bottom-line contribution margin.”
Clean measurement is what closes the gap. When we rebuilt attribution for a premium pet brand whose branded and non-branded spend were mixed in one campaign, separating the two revealed that non-branded was working far better than the blended number implied.
Non-branded revenue grew 105% while CAC held flat at $45. The platform view had been hiding it. Separating the two is one check inside our 9-point Google Ads audit.
aMER: Is Paid Actually Acquiring New Customers?
Blended MER tells you how efficient the whole machine is, but it can still mask a slow bleed: paid spend taking credit for repeat customers who would have bought anyway. aMER, or acquisition MER (some teams call it new-customer MER), isolates that by dividing new-customer revenue by total marketing spend.
aMER = new customer revenue / total marketing spendThe two numbers read together. When MER holds steady but aMER falls, your paid budget is increasingly recycling existing demand instead of bringing in new buyers, which is the cannibalization pattern with a number finally attached to it.
For brands whose whole reason to spend on paid is acquisition, aMER is often an earlier warning light than blended MER alone.
What DTC Brands Get Wrong About MER and ROAS
The most expensive mistake is optimizing to platform ROAS while MER declines underneath it. The channel dashboard looks strong, spend goes up, and blended efficiency erodes because incremental spend is cannibalizing revenue the business would have captured for free.
Watching only MER is the opposite failure: you know the machine is getting less efficient, but not which channel to fix.
Two more show up constantly. Comparing ROAS across channels with different attribution windows treats non-comparable numbers as if they were the same. And reading a high ROAS as profit ignores what a sale actually costs, which is why contribution margin belongs next to both metrics, alongside the CAC math that platform numbers distort.
Fixing all of this is mostly a reporting problem. Rebuilding reporting around revenue-predictive metrics is the first thing we do when we take over a paid media account.
What Is a Good MER?
There is no universal “good” MER, and any number quoted without a margin attached is close to meaningless.
Your break-even MER is 1 divided by your contribution margin: a brand at 40% margin breaks even at 2.5, while a 25%-margin brand does not break even until 4.0. Everything above that line is what funds growth.
As a rough industry reference, most DTC brands treat a blended MER in the 3x to 5x range as healthy, but that band only means something once you overlay your own margin.
A 5x MER is thin for a low-margin brand and generous for a high-margin one. Start from the break-even math, then set a target above it that funds the growth rate you actually want, rather than borrowing a number from another brand's P&L.
Frequently Asked Questions
1. What Is MER?
MER, or Marketing Efficiency Ratio, is total revenue divided by total marketing spend across all channels in a period. Unlike ROAS, it is not attributed to any single channel, so it reflects what the entire marketing investment produced. A MER of 4 means the business earned $4 in revenue for every $1 spent on marketing.
2. MER vs ROAS: Which Is Better?
Neither, because they answer different questions. ROAS judges one channel's attributed return and is best for in-platform optimization. MER judges the whole business and is best for budget and scaling decisions. Relying on ROAS alone hides cannibalization, and relying on MER alone hides which channel needs the fix.
3. How Do You Calculate Marketing Efficiency Ratio?
Divide total revenue by total marketing spend for the same period. A brand that did $500K in revenue on $125K of total marketing spend has a MER of 4.0. Decide up front whether marketing spend means ad spend only or also includes agency fees, tools, and creative, then keep that definition consistent so the number stays comparable month to month.
4. How Often Should You Check MER?
Watch MER daily for awareness, but act on it weekly or monthly. Day-to-day noise like shipping cutoffs, promo spikes, and weekend dips will whipsaw a daily read. Reserve fast, in-platform reactions for ROAS, and use the longer MER trend for budget and scaling calls.